
Guides

How to Measure Customer Marketing Impact: A Practitioner's Playbook

You know your customer marketing programs are influencing deals, retaining accounts, and driving expansion revenue. But can you prove it?

The gap between knowing your programs matter and being able to show it in the boardroom is where a lot of customer marketers get stuck. This playbook is a practical guide for what to measure, how to get the right data, and how to use it across three stages of customer marketing maturity.

Let's get into it.

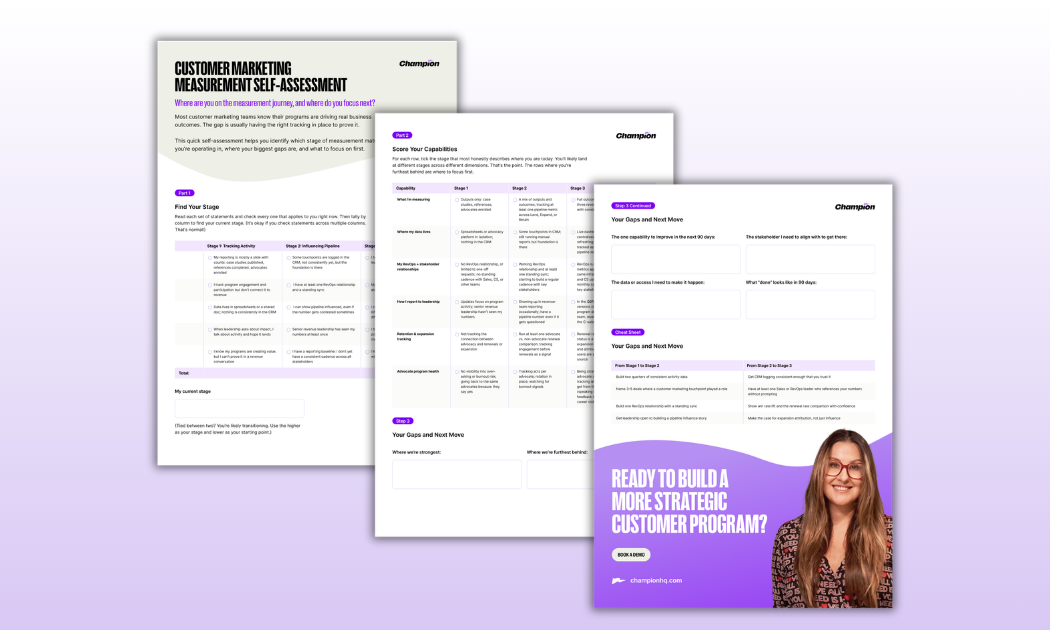
Measurement Maturity Assessment
Stage 1: Tracking Activity

What Stage 1 Looks Like

At this stage, you're doing what most customer marketing roles were designed to do: fulfill requests, produce assets, and maintain a list of advocates. Case studies published, references completed, advocates enrolled are the foundation of a healthy program, and the starting point for what comes next.

But what you should actually be doing is laying the groundwork to align across the entire go-to-market team. What are the larger goals for marketing, sales, and the business as a whole? Understanding what your peers are trying to accomplish will help you frame your program around real business needs.

A few questions worth asking:

  • Are they trying to break into a new vertical or segment? Your advocates and case studies can open those doors. Start building coverage now.
  • Is win rate a problem in a particular segment or deal size? A targeted reference and proof-point program for those situations is something you can start tracking in Stage 1.
  • Is expansion the growth priority? Look at which accounts are in your advocacy program and which aren't. That gap is your Stage 2 story.
Why teams get stuck at Stage 1

Most teams stay here because leadership isn't asking for more yet, so there's no pressure to change. Or because they don't have data access or the right tools to tell a different story. Or because they underestimate how much work the transition actually requires. All three are solvable, but you have to name what's in the way before you can move past it.

"Many companies I work with have a list of referencable customers and a mandate to grow that number as large as possible. What they don't have yet is a formal program and a system to create value for advocates in exchange for their contributions." — Brian Oblinger, Community and Customer Marketing Consultant

What to Measure at Stage 1

At Stage 1, the goal is to create a consistent baseline you can build on. Two categories of data matter here, and they serve different purposes.

Program health: for you and your team

These metrics tell you whether your program is actually working. If your program isn't healthy, pipeline numbers won't hold.

  • Member engagement rate: what percentage of your advocate pool is actively participating each quarter
  • Activation rate: what percentage of members have completed at least one ask or activity in the last 90 days
  • Advocate response rate when you reach out
  • Average time to fulfill a reference request
  • Percentage of customers who are referenceable, a capacity signal that often goes unmeasured until it becomes a crisis
Program output: your Stage 2 baseline

These are the numbers you'll eventually connect to revenue. Start tracking them consistently now.

  • References completed (by type: call, written, site visit)
  • Case studies published (by use case, segment, or product line)
  • Reviews generated (by platform)
  • Event speakers sourced
  • Content contributed (webinar appearances, blog posts, media mentions)
  • Advocates enrolled and churned per quarter
Capacity signals: your early warning system
  • Acts per advocate per quarter. If your top five advocates are handling 80% of your asks, you have a structural problem that will catch up with you in Stage 2.
  • New advocate adds vs. churn. A shrinking bench means shrinking options.

What not to lead with in leadership conversations: raw counts without context or comparison. "We completed 14 references this quarter" is hard to evaluate without a baseline, a benchmark, or a connection to what those references did. Numbers without context don't land.

"Don’t wait for the perfect dashboard. Get one number that connects advocacy to business outcomes and ride it for six months. Talk about it in every meeting, every deck, and every performance review. Then add a second number and repeat. A whole bunch of little ones makes a big one." — Brian Oblinger, Community and Customer Marketing Consultant

How to Get the Data at Stage 1

Most Stage 1 data lives in tools you already control, like your advocacy platform, a spreadsheet, or a shared doc. You don't need CRM access to get started. But before you build your first report, take 30 minutes to map your stakeholders and what each one actually cares about:

  • Events team: Speaker sourcing data: who's talked publicly about you, on what topics, how they performed
  • Customer Success: Which customers are engaged, renewal risk signals like open support tickets, seats used, and training participation, coverage across their book of business
  • Sales: Deal support availability and who's referenceable by segment
  • Demand gen / content: Review volume, proof point coverage, content asset availability

Knowing what each team needs before you start building saves real effort and keeps you from creating a report that tries to answer everyone's question and ends up answering no one's.

To build your tracking foundation:

  • Create a simple activity log if you don't have one yet: date, request type, advocate, outcome
  • Start tagging advocates by segment, use case, and account tier now. You'll need those tags in Stage 2.
  • Document your definitions in writing: what counts as an "active" advocate? What counts as a completed reference?
  • Treat your advocacy platform dashboard as your Stage 1 source of truth. Connecting it to your CRM is the next step.

How to Use Your Data at Stage 1

Your audience at Stage 1 is primarily your marketing leadership and your CS team, but the groundwork can be laid now for cross-functional alignment. Consider meeting or sharing reports with all function leaders or stakeholders on a regular cadence. 

  • Report the same metrics every quarter. Trends are more useful than snapshots, and you can only show trends if you're tracking consistently.
  • Frame activity in terms of program health, not just volume: "We fulfilled 14 references with 9 unique advocates. That's a high concentration. We're building the bench."
  • Use your Stage 1 data to make the internal case for Stage 2 access: "Here's what we're producing. Here's why we need CRM visibility to show what it's actually worth."
  • Don't wait for a perfect story to start telling one.

Signs You're Ready for Stage 2

  • You have at least two quarters of consistent activity data
  • You can name three to five specific deals where a customer marketing touchpoint played a role, even if it's not formally tracked yet
  • You have, or can build, a relationship with someone in RevOps or Sales Ops
  • Your marketing leadership is open to you building a pipeline influence story
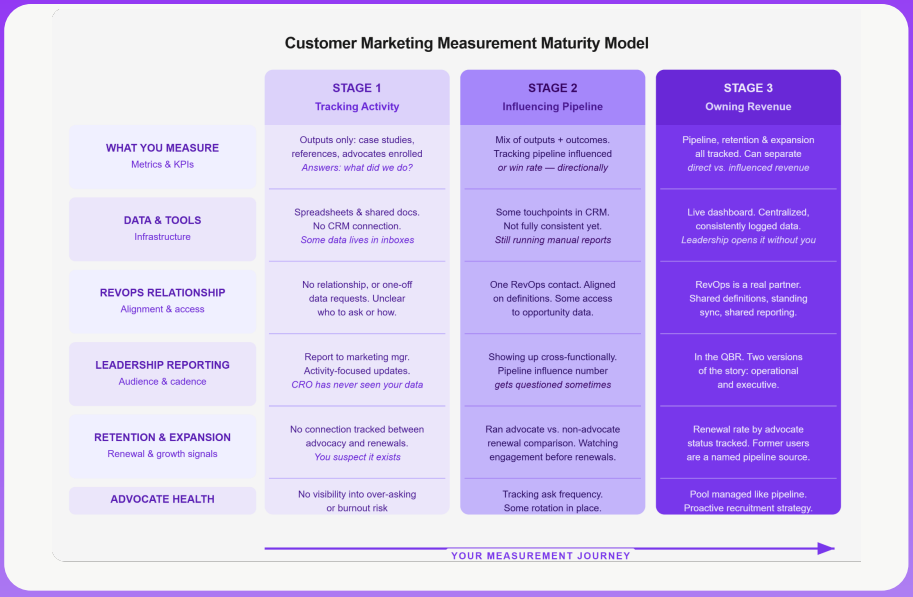
Most customer marketing teams are somewhere between Stage 1 and Stage 2

Stage 2: Influencing Pipeline

What Stage 2 Looks Like

Stage 2 is where customer marketing enters the revenue conversation for the first time, and where it usually gets complicated. "Pipeline influenced" is a contested number at most companies. Sales will debate attribution, RevOps will have opinions about what counts, and your CFO will ask what "influenced" actually means.

That's why it's important to define your terms before you build your reports.

The goal at Stage 2 is a defensible, consistently tracked view of how your programs are touching the business across three revenue motions: new business (Land), growth in existing accounts (Expand), and retention (Retain). That framing maps to how your CRO already thinks about revenue, and it's a harder number to contest than a single "pipeline influenced" figure.

Consistency matters more than perfection, especially this early.

"Perfection is the enemy of storytelling and gaining buy-in. You can say, 'this is the best we can do with the data we have today. Here's the directional value we believe we're creating.' In most organizations, leadership will say: ‘great, keep going and report back.’" — Brian Oblinger, Community and Customer Marketing Consultant

What to Measure at Stage 2

Land: new business pipeline
  • Deals with at least one logged customer marketing touchpoint (reference call, case study shared by AE, peer intro, review cited during evaluation)
  • Win rate: deals with a touchpoint vs. deals without. This is often the comparison that moves CROs.
  • Pipeline influenced (direct): deals where a touchpoint is logged as a contributing factor in the closed-won record
  • Pipeline influenced (total): all deals where any touchpoint occurred, regardless of outcome
  • Deal velocity: average days to close with a touchpoint vs. without
  • Time to first act of advocacy: how quickly a new customer engages with your programs is an early indicator of long-term participation
Expand: growth in existing accounts
  • Expansion revenue in advocate accounts vs. non-advocate accounts
  • Upsell or cross-sell attach rate in accounts with active advocates
  • Advocacy cohort product adoption: customers in active advocacy programs tend to adopt more of the product
  • Percent of users with positive AI health score per account
Retain: renewal and churn prevention
  • Renewal rate: advocate accounts vs. non-advocate accounts. This is the clearest comparison you can run and often the most persuasive number in a CS conversation.
  • Advocate engagement in the 90 days before renewal: declining engagement is a churn signal
  • Accounts with zero advocacy engagement in the 90 days before renewal (flag list to share with CS)
  • Percentage of referenceable customers by tier
Capacity and health
  • Acts per advocate per quarter: if this number is climbing, your bench is too thin to scale
  • Reference request fulfillment rate: if you're declining or delaying requests, document why. That's your case for more resources.
  • LTV per advocate: when this number is strong, it's your most compelling argument for investing in more advocates. But keep an eye on distribution. Over-indexing on one or two advocates can lead to burnout. 
Pro Tip: Run the advocate vs. non-advocate renewal comparison before your next QBR and share it with your CS leadership.

How to Get the Data at Stage 2

Building the RevOps relationship

This is where you'll need RevOps support. Find an ally in RevOps who's willing to help you build the right fields and tagging, and ask for a standing 30-minute monthly sync. Consistency matters for your data quality and the relationship itself.

Making your touchpoints loggable

Work with RevOps to add a touchpoint field to the opportunity record, or use an existing activity type that Sales already logs. The simpler the logging process, the more likely AEs will use it. One dropdown field is better than a five-field form, and if you can build logging into an existing Sales workflow, adoption will be higher.

Defining "pipeline influenced" at your company

Get alignment on what counts as a touchpoint, the attribution window (30 days? 90 days? the full deal cycle?), and whether you're counting open pipeline, closed-won, or both. Document the definition.

Building a stakeholder cadence

Data access is only half of the challenge in Stage 2. The other half is making sure the right people see the right metrics regularly, before you need something from them.

Establish a standing meeting with each key stakeholder team: CS, Sales, demand gen, events, whoever relies on your programs. Monthly is ideal. The agenda doesn't have to be elaborate: what are you working on, what are they hearing from customers, where do your worlds overlap, what stories do you need?

"Go make friends internally. Figure out who else is doing measurement like this, regardless of what team they’re on. Offer them some value, then ask what’s worked for them and if they can help you. The road to success is paved with basic cross-functional relationship building." — Brian Oblinger, Community and Customer Marketing Consultant

How to Use Your Data at Stage 2

At Stage 2, your audience expands to include Sales leadership and other teams. The goal is getting your numbers in front of the people making revenue decisions.

Lead with the comparison, not the count. A raw pipeline number without a comparison point is hard to evaluate. Try: "Deals with a customer reference close at X%. Deals without close at Y%." The delta is the story.

Use Land, Expand, Retain as your framework. It maps to how CROs already think about revenue and shows your program's reach across the full customer lifecycle, not just pre-sale.

Know your audience. Different stakeholders care about different parts of the lifecycle:

  • Peer reviews and case studies influence discovery and evaluation: that's demand gen and Sales
  • Reference calls and proof points support active deals: that's the AE team
  • Community engagement and user events support retention and adoption: that's CS
  • Event speaking and thought leadership content serves your events team and brand

Tailor the metric to the conversation. Your CS partner doesn't need your win rate lift: they need the renewal rate comparison.

Signs You're Ready for Stage 3

  • Your touchpoints are consistently logged in the CRM and you trust the data
  • You have at least one Sales or RevOps leader who references your numbers without prompting
  • You can show win rate lift and the renewal rate comparison with confidence
  • You're ready to make the case for expansion attribution

Stage 3: Owning Revenue

What Stage 3 Looks Like

Stage 3 looks a lot like Stage 2. The difference is the numbers are doing more of the talking.

At Stage 3, your program's contribution to revenue is visible without explanation. It shows up in pipeline reports, board decks, and leadership asks for it. Budget conversations go from defending spend to asking for more.

Getting here takes three things that build on each other: consistent data, cross-functional trust, and knowing how to tell your story to the people holding the budget.

"We’re often so focused on showing the quantitative — the numbers and the dollars — that we forget to show the qualitative. There are real humans here. Tell their stories, figure out what makes them tick, and put their success first. The dollars will follow." — Brian Oblinger, Community and Customer Marketing Consultant

What to Measure at Stage 3

At Stage 3, you're tracking everything from Stages 1 and 2, plus:

Direct revenue attribution
  • Closed-won revenue where a customer marketing touchpoint is logged as a direct contributing factor
  • Revenue from deals sourced by former users and job change tracking (tracked as a named pipeline source)
  • Expansion revenue in advocate accounts, tracked separately as directly attributed
  • Customer acquisition cost (CAC) impact: if your advocate-sourced pipeline closes at higher rates with shorter cycles, the CAC math changes. At Stage 3, you can show it.
NRR impact
  • Renewal rate delta between advocate and non-advocate accounts, tracked consistently over time
  • Expansion rate in accounts with active advocates vs. without
  • Churn risk flags from advocate disengagement before renewal
  • Advocate lifetime value (LTV) compared to non-advocate LTV: advocates retain longer, expand more, and tend to cost less to support
Program-level ROI
  • Revenue per active advocate
  • Cost per reference vs. deal value influenced
  • Former user pipeline as a named source with its own line in pipeline reporting
  • Advocacy cohort product adoption: customers who participate in your programs tend to adopt more features and expand faster
Acts of advocacy: by type and by impact

Stage 3 teams track which advocacy activities actually move deals, not just how many happened. Break acts of advocacy down by type: reference calls, peer reviews, event speaking, case studies, analyst calls, community contributions, media coverage. Track each against pipeline influenced and win rate to learn which activities drive the most impact, then be strategic about how you use your advocates' time.

Advocate success metrics

Stage 3 programs track what advocates get, not just what the business gets. Programs that don't track advocate outcomes burn through their best people.

  • Speaking engagements sourced for advocates (conferences, webinars, roundtables)
  • Product feedback submitted and implemented
  • Awards won, media appearances enabled, leadership visibility created
  • Career outcomes tied to program participation

"Think about what's in it for your champions. How does this impact their career? What opportunities for visibility are you creating? Are you actually taking their feedback and implementing it? Are you partners in bi-directional success?" — Brian Oblinger, Community and Customer Marketing Consultant

How to Get the Data at Stage 3

By Stage 3, the infrastructure is in place. You're maintaining and refining it, not building from scratch. What's different:

  • You have a live dashboard, not a quarterly report you build manually
  • You've moved from influence (any touchpoint in the deal) to attribution (touchpoint as a logged contributing factor in closed-won)
  • You're working with Finance or RevOps to connect program costs to revenue outcomes: a program ROI case, not just a pipeline influence case
  • Former user pipeline is a named source the same way "inbound" or "outbound" is
Pro Tip: The cleaner your Stage 2 data, the easier Stage 3 becomes. If you're cutting corners on CRM logging in Stage 2, you'll hit a ceiling.

How to Use Your Data at Stage 3

Two versions of the story: know which one you're telling

Stage 3 practitioners don't walk into every meeting with the same report.

Internal program view (for your team and marketing leadership): Reference utilization by segment, acts per advocate, advocate deal velocity, job change pipeline by cohort, advocate engagement before renewal, program cost vs. revenue generated. This is how you run the program better and catch problems before they become gaps.

Executive view (for your CRO and CFO): Pipeline influenced across Land, Expand, and Retain; win rate lift; direct revenue attributed; NRR impact; expansion from advocate accounts; former user pipeline. Strip out the program mechanics. Lead with the number that connects to their quarter.

The human layer

Alongside the revenue metrics, bring one or two specific examples: a deal that closed because of a reference call, an expansion that started at a user event, a customer who's spoken at five conferences since joining your program. Numbers show the scale. Stories show the relationships behind them.

What's emerging: AI discoverability

Stage 3 teams are beginning to track a new category of influence: how customer advocacy shapes what AI tools say about you.

AI tools increasingly inform B2B buying decisions, and they surface the same signals you're already building: peer reviews, customer case studies, community discussions, media coverage, and publicly accessible content. Your advocacy content is out there. The question is whether it's accurate, current, and reflects what your best customers actually think.

Teams building in this direction are tracking four dimensions:

  1. Community presence: where customers are talking about you publicly, including third-party forums and communities you don't control
  2. Advocacy activation: nurturing customers to talk about you organically, not just when you send a request
  3. Evidence and amplification: making sure your case studies, videos, and content are ungated, accessible, and have transcripts that AI tools can use. Peer reviews are one of the most valuable inputs for AI tools and often the most underinvested channel.
  4. Sentiment: making sure what's being said reflects the experience you're actually delivering
Winning the budget conversation

At Stage 3, budget conversations shift from "justify the cost of your program" to "how much more should we invest?" Show up every quarter with the same metrics. Your numbers should be part of the conversation before anyone has to ask.

The point isn't measurement just to measure. It's getting credit for the real outcomes your programs are already creating for your business and your advocates. This is how you build that case, stage by stage, without waiting until you have the perfect report.

Share a few contact details and we'll provide you with a download of the ebook.
Oops! Something went wrong while submitting the form.

How to Measure Customer Marketing Impact: A Practitioner's Playbook

Champion
Goal
Key Capability
Impact

You know your customer marketing programs are influencing deals, retaining accounts, and driving expansion revenue. But can you prove it?

The gap between knowing your programs matter and being able to show it in the boardroom is where a lot of customer marketers get stuck. This playbook is a practical guide for what to measure, how to get the right data, and how to use it across three stages of customer marketing maturity.

Let's get into it.

Measurement Maturity Assessment

Stage 1: Tracking Activity

What Stage 1 Looks Like

At this stage, you're doing what most customer marketing roles were designed to do: fulfill requests, produce assets, and maintain a list of advocates. Case studies published, references completed, advocates enrolled are the foundation of a healthy program, and the starting point for what comes next.

But what you should actually be doing is laying the groundwork to align across the entire go-to-market team. What are the larger goals for marketing, sales, and the business as a whole? Understanding what your peers are trying to accomplish will help you frame your program around real business needs.

A few questions worth asking:

  • Are they trying to break into a new vertical or segment? Your advocates and case studies can open those doors. Start building coverage now.
  • Is win rate a problem in a particular segment or deal size? A targeted reference and proof-point program for those situations is something you can start tracking in Stage 1.
  • Is expansion the growth priority? Look at which accounts are in your advocacy program and which aren't. That gap is your Stage 2 story.
Why teams get stuck at Stage 1

Most teams stay here because leadership isn't asking for more yet, so there's no pressure to change. Or because they don't have data access or the right tools to tell a different story. Or because they underestimate how much work the transition actually requires. All three are solvable, but you have to name what's in the way before you can move past it.

"Many companies I work with have a list of referencable customers and a mandate to grow that number as large as possible. What they don't have yet is a formal program and a system to create value for advocates in exchange for their contributions." — Brian Oblinger, Community and Customer Marketing Consultant

What to Measure at Stage 1

At Stage 1, the goal is to create a consistent baseline you can build on. Two categories of data matter here, and they serve different purposes.

Program health: for you and your team

These metrics tell you whether your program is actually working. If your program isn't healthy, pipeline numbers won't hold.

  • Member engagement rate: what percentage of your advocate pool is actively participating each quarter
  • Activation rate: what percentage of members have completed at least one ask or activity in the last 90 days
  • Advocate response rate when you reach out
  • Average time to fulfill a reference request
  • Percentage of customers who are referenceable, a capacity signal that often goes unmeasured until it becomes a crisis
Program output: your Stage 2 baseline

These are the numbers you'll eventually connect to revenue. Start tracking them consistently now.

  • References completed (by type: call, written, site visit)
  • Case studies published (by use case, segment, or product line)
  • Reviews generated (by platform)
  • Event speakers sourced
  • Content contributed (webinar appearances, blog posts, media mentions)
  • Advocates enrolled and churned per quarter
Capacity signals: your early warning system
  • Acts per advocate per quarter. If your top five advocates are handling 80% of your asks, you have a structural problem that will catch up with you in Stage 2.
  • New advocate adds vs. churn. A shrinking bench means shrinking options.

What not to lead with in leadership conversations: raw counts without context or comparison. "We completed 14 references this quarter" is hard to evaluate without a baseline, a benchmark, or a connection to what those references did. Numbers without context don't land.

"Don’t wait for the perfect dashboard. Get one number that connects advocacy to business outcomes and ride it for six months. Talk about it in every meeting, every deck, and every performance review. Then add a second number and repeat. A whole bunch of little ones makes a big one." — Brian Oblinger, Community and Customer Marketing Consultant

How to Get the Data at Stage 1

Most Stage 1 data lives in tools you already control, like your advocacy platform, a spreadsheet, or a shared doc. You don't need CRM access to get started. But before you build your first report, take 30 minutes to map your stakeholders and what each one actually cares about:

  • Events team: Speaker sourcing data: who's talked publicly about you, on what topics, how they performed
  • Customer Success: Which customers are engaged, renewal risk signals like open support tickets, seats used, and training participation, coverage across their book of business
  • Sales: Deal support availability and who's referenceable by segment
  • Demand gen / content: Review volume, proof point coverage, content asset availability

Knowing what each team needs before you start building saves real effort and keeps you from creating a report that tries to answer everyone's question and ends up answering no one's.

To build your tracking foundation:

  • Create a simple activity log if you don't have one yet: date, request type, advocate, outcome
  • Start tagging advocates by segment, use case, and account tier now. You'll need those tags in Stage 2.
  • Document your definitions in writing: what counts as an "active" advocate? What counts as a completed reference?
  • Treat your advocacy platform dashboard as your Stage 1 source of truth. Connecting it to your CRM is the next step.

How to Use Your Data at Stage 1

Your audience at Stage 1 is primarily your marketing leadership and your CS team, but the groundwork can be laid now for cross-functional alignment. Consider meeting or sharing reports with all function leaders or stakeholders on a regular cadence. 

  • Report the same metrics every quarter. Trends are more useful than snapshots, and you can only show trends if you're tracking consistently.
  • Frame activity in terms of program health, not just volume: "We fulfilled 14 references with 9 unique advocates. That's a high concentration. We're building the bench."
  • Use your Stage 1 data to make the internal case for Stage 2 access: "Here's what we're producing. Here's why we need CRM visibility to show what it's actually worth."
  • Don't wait for a perfect story to start telling one.

Signs You're Ready for Stage 2

  • You have at least two quarters of consistent activity data
  • You can name three to five specific deals where a customer marketing touchpoint played a role, even if it's not formally tracked yet
  • You have, or can build, a relationship with someone in RevOps or Sales Ops
  • Your marketing leadership is open to you building a pipeline influence story
Most customer marketing teams are somewhere between Stage 1 and Stage 2

Stage 2: Influencing Pipeline

What Stage 2 Looks Like

Stage 2 is where customer marketing enters the revenue conversation for the first time, and where it usually gets complicated. "Pipeline influenced" is a contested number at most companies. Sales will debate attribution, RevOps will have opinions about what counts, and your CFO will ask what "influenced" actually means.

That's why it's important to define your terms before you build your reports.

The goal at Stage 2 is a defensible, consistently tracked view of how your programs are touching the business across three revenue motions: new business (Land), growth in existing accounts (Expand), and retention (Retain). That framing maps to how your CRO already thinks about revenue, and it's a harder number to contest than a single "pipeline influenced" figure.

Consistency matters more than perfection, especially this early.

"Perfection is the enemy of storytelling and gaining buy-in. You can say, 'this is the best we can do with the data we have today. Here's the directional value we believe we're creating.' In most organizations, leadership will say: ‘great, keep going and report back.’" — Brian Oblinger, Community and Customer Marketing Consultant

What to Measure at Stage 2

Land: new business pipeline
  • Deals with at least one logged customer marketing touchpoint (reference call, case study shared by AE, peer intro, review cited during evaluation)
  • Win rate: deals with a touchpoint vs. deals without. This is often the comparison that moves CROs.
  • Pipeline influenced (direct): deals where a touchpoint is logged as a contributing factor in the closed-won record
  • Pipeline influenced (total): all deals where any touchpoint occurred, regardless of outcome
  • Deal velocity: average days to close with a touchpoint vs. without
  • Time to first act of advocacy: how quickly a new customer engages with your programs is an early indicator of long-term participation
Expand: growth in existing accounts
  • Expansion revenue in advocate accounts vs. non-advocate accounts
  • Upsell or cross-sell attach rate in accounts with active advocates
  • Advocacy cohort product adoption: customers in active advocacy programs tend to adopt more of the product
  • Percent of users with positive AI health score per account
Retain: renewal and churn prevention
  • Renewal rate: advocate accounts vs. non-advocate accounts. This is the clearest comparison you can run and often the most persuasive number in a CS conversation.
  • Advocate engagement in the 90 days before renewal: declining engagement is a churn signal
  • Accounts with zero advocacy engagement in the 90 days before renewal (flag list to share with CS)
  • Percentage of referenceable customers by tier
Capacity and health
  • Acts per advocate per quarter: if this number is climbing, your bench is too thin to scale
  • Reference request fulfillment rate: if you're declining or delaying requests, document why. That's your case for more resources.
  • LTV per advocate: when this number is strong, it's your most compelling argument for investing in more advocates. But keep an eye on distribution. Over-indexing on one or two advocates can lead to burnout. 
Pro Tip: Run the advocate vs. non-advocate renewal comparison before your next QBR and share it with your CS leadership.

How to Get the Data at Stage 2

Building the RevOps relationship

This is where you'll need RevOps support. Find an ally in RevOps who's willing to help you build the right fields and tagging, and ask for a standing 30-minute monthly sync. Consistency matters for your data quality and the relationship itself.

Making your touchpoints loggable

Work with RevOps to add a touchpoint field to the opportunity record, or use an existing activity type that Sales already logs. The simpler the logging process, the more likely AEs will use it. One dropdown field is better than a five-field form, and if you can build logging into an existing Sales workflow, adoption will be higher.

Defining "pipeline influenced" at your company

Get alignment on what counts as a touchpoint, the attribution window (30 days? 90 days? the full deal cycle?), and whether you're counting open pipeline, closed-won, or both. Document the definition.

Building a stakeholder cadence

Data access is only half of the challenge in Stage 2. The other half is making sure the right people see the right metrics regularly, before you need something from them.

Establish a standing meeting with each key stakeholder team: CS, Sales, demand gen, events, whoever relies on your programs. Monthly is ideal. The agenda doesn't have to be elaborate: what are you working on, what are they hearing from customers, where do your worlds overlap, what stories do you need?

"Go make friends internally. Figure out who else is doing measurement like this, regardless of what team they’re on. Offer them some value, then ask what’s worked for them and if they can help you. The road to success is paved with basic cross-functional relationship building." — Brian Oblinger, Community and Customer Marketing Consultant

How to Use Your Data at Stage 2

At Stage 2, your audience expands to include Sales leadership and other teams. The goal is getting your numbers in front of the people making revenue decisions.

Lead with the comparison, not the count. A raw pipeline number without a comparison point is hard to evaluate. Try: "Deals with a customer reference close at X%. Deals without close at Y%." The delta is the story.

Use Land, Expand, Retain as your framework. It maps to how CROs already think about revenue and shows your program's reach across the full customer lifecycle, not just pre-sale.

Know your audience. Different stakeholders care about different parts of the lifecycle:

  • Peer reviews and case studies influence discovery and evaluation: that's demand gen and Sales
  • Reference calls and proof points support active deals: that's the AE team
  • Community engagement and user events support retention and adoption: that's CS
  • Event speaking and thought leadership content serves your events team and brand

Tailor the metric to the conversation. Your CS partner doesn't need your win rate lift: they need the renewal rate comparison.

Signs You're Ready for Stage 3

  • Your touchpoints are consistently logged in the CRM and you trust the data
  • You have at least one Sales or RevOps leader who references your numbers without prompting
  • You can show win rate lift and the renewal rate comparison with confidence
  • You're ready to make the case for expansion attribution

Stage 3: Owning Revenue

What Stage 3 Looks Like

Stage 3 looks a lot like Stage 2. The difference is the numbers are doing more of the talking.

At Stage 3, your program's contribution to revenue is visible without explanation. It shows up in pipeline reports, board decks, and leadership asks for it. Budget conversations go from defending spend to asking for more.

Getting here takes three things that build on each other: consistent data, cross-functional trust, and knowing how to tell your story to the people holding the budget.

"We’re often so focused on showing the quantitative — the numbers and the dollars — that we forget to show the qualitative. There are real humans here. Tell their stories, figure out what makes them tick, and put their success first. The dollars will follow." — Brian Oblinger, Community and Customer Marketing Consultant

What to Measure at Stage 3

At Stage 3, you're tracking everything from Stages 1 and 2, plus:

Direct revenue attribution
  • Closed-won revenue where a customer marketing touchpoint is logged as a direct contributing factor
  • Revenue from deals sourced by former users and job change tracking (tracked as a named pipeline source)
  • Expansion revenue in advocate accounts, tracked separately as directly attributed
  • Customer acquisition cost (CAC) impact: if your advocate-sourced pipeline closes at higher rates with shorter cycles, the CAC math changes. At Stage 3, you can show it.
NRR impact
  • Renewal rate delta between advocate and non-advocate accounts, tracked consistently over time
  • Expansion rate in accounts with active advocates vs. without
  • Churn risk flags from advocate disengagement before renewal
  • Advocate lifetime value (LTV) compared to non-advocate LTV: advocates retain longer, expand more, and tend to cost less to support
Program-level ROI
  • Revenue per active advocate
  • Cost per reference vs. deal value influenced
  • Former user pipeline as a named source with its own line in pipeline reporting
  • Advocacy cohort product adoption: customers who participate in your programs tend to adopt more features and expand faster
Acts of advocacy: by type and by impact

Stage 3 teams track which advocacy activities actually move deals, not just how many happened. Break acts of advocacy down by type: reference calls, peer reviews, event speaking, case studies, analyst calls, community contributions, media coverage. Track each against pipeline influenced and win rate to learn which activities drive the most impact, then be strategic about how you use your advocates' time.

Advocate success metrics

Stage 3 programs track what advocates get, not just what the business gets. Programs that don't track advocate outcomes burn through their best people.

  • Speaking engagements sourced for advocates (conferences, webinars, roundtables)
  • Product feedback submitted and implemented
  • Awards won, media appearances enabled, leadership visibility created
  • Career outcomes tied to program participation

"Think about what's in it for your champions. How does this impact their career? What opportunities for visibility are you creating? Are you actually taking their feedback and implementing it? Are you partners in bi-directional success?" — Brian Oblinger, Community and Customer Marketing Consultant

How to Get the Data at Stage 3

By Stage 3, the infrastructure is in place. You're maintaining and refining it, not building from scratch. What's different:

  • You have a live dashboard, not a quarterly report you build manually
  • You've moved from influence (any touchpoint in the deal) to attribution (touchpoint as a logged contributing factor in closed-won)
  • You're working with Finance or RevOps to connect program costs to revenue outcomes: a program ROI case, not just a pipeline influence case
  • Former user pipeline is a named source the same way "inbound" or "outbound" is
Pro Tip: The cleaner your Stage 2 data, the easier Stage 3 becomes. If you're cutting corners on CRM logging in Stage 2, you'll hit a ceiling.

How to Use Your Data at Stage 3

Two versions of the story: know which one you're telling

Stage 3 practitioners don't walk into every meeting with the same report.

Internal program view (for your team and marketing leadership): Reference utilization by segment, acts per advocate, advocate deal velocity, job change pipeline by cohort, advocate engagement before renewal, program cost vs. revenue generated. This is how you run the program better and catch problems before they become gaps.

Executive view (for your CRO and CFO): Pipeline influenced across Land, Expand, and Retain; win rate lift; direct revenue attributed; NRR impact; expansion from advocate accounts; former user pipeline. Strip out the program mechanics. Lead with the number that connects to their quarter.

The human layer

Alongside the revenue metrics, bring one or two specific examples: a deal that closed because of a reference call, an expansion that started at a user event, a customer who's spoken at five conferences since joining your program. Numbers show the scale. Stories show the relationships behind them.

What's emerging: AI discoverability

Stage 3 teams are beginning to track a new category of influence: how customer advocacy shapes what AI tools say about you.

AI tools increasingly inform B2B buying decisions, and they surface the same signals you're already building: peer reviews, customer case studies, community discussions, media coverage, and publicly accessible content. Your advocacy content is out there. The question is whether it's accurate, current, and reflects what your best customers actually think.

Teams building in this direction are tracking four dimensions:

  1. Community presence: where customers are talking about you publicly, including third-party forums and communities you don't control
  2. Advocacy activation: nurturing customers to talk about you organically, not just when you send a request
  3. Evidence and amplification: making sure your case studies, videos, and content are ungated, accessible, and have transcripts that AI tools can use. Peer reviews are one of the most valuable inputs for AI tools and often the most underinvested channel.
  4. Sentiment: making sure what's being said reflects the experience you're actually delivering
Winning the budget conversation

At Stage 3, budget conversations shift from "justify the cost of your program" to "how much more should we invest?" Show up every quarter with the same metrics. Your numbers should be part of the conversation before anyone has to ask.

The point isn't measurement just to measure. It's getting credit for the real outcomes your programs are already creating for your business and your advocates. This is how you build that case, stage by stage, without waiting until you have the perfect report.

Share On:
Share on LinkedIn
Share on Twitter