


We recently hosted a session with CMA Weekly called Metrics That Matter, led by our COO Gianna Scorsone, alongside our VP of Customer Success Emily Cid and community leader Brian Oblinger. Our past CMA sessions covered how to launch a customer marketing program and get early team buy-in, but the question that kept coming up was some version of: 'I know the impact my program has, so how do I actually show that to leadership?' Metrics That Matter skipped the theory and went straight into the frameworks, the numbers, and the conversations that get advocacy taken seriously in the boardroom.
If you missed it, check out the highlights and recording below.
1. It's all about context
Most teams default to operational metrics, like the raw counts of referrals, case studies, posts, and interactions. Those numbers matter, but on their own they don't travel well. Tell an executive "we had 50 referrals last quarter" and you'll get a blank stare, or worse, a demand to make it 500.
The fix, Brian explained, is to run every operational metric through a second filter: what business outcome does this actually move? Every company, regardless of how it phrases it, is chasing four or five things: new revenue, retention, expansion, and lowering the cost to serve customers. A count becomes useful once it's translated into one of those terms.
2. Map your program before you measure it
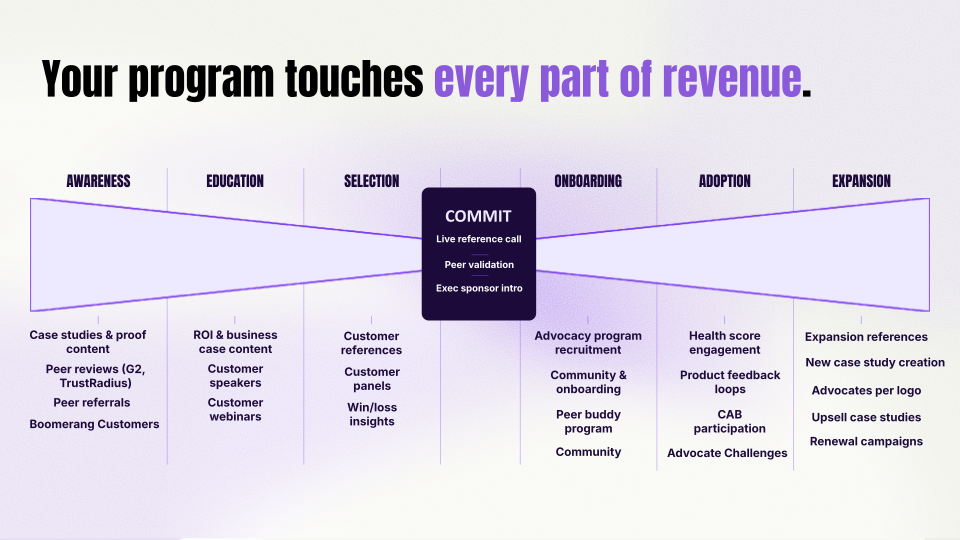
That translation gets easier with a simple exercise Emily has run with her own team: list every program, asset, and activity you run, then map each one to a stage of the customer journey. No math, no pulling in RevOps, no attribution modeling. Just a plain look at where your work actually touches the business.
The exercise tends to reveal that a single activity reaches further than you'd think. References, for example, often show up at decision, again at selection, and once again as a deal is close to committing, not just in one tidy spot on a funnel diagram.
3. Climb the maturity staircase
Once you've mapped your a starting point, the work tends to move through three stages of measuring customer marketing impact. The first is simply counting: how many case studies, how many referrals. Plenty of programs haven't even locked that down yet, so there's no shame in starting here.
The second stage is comparison. What's the retention rate for accounts with an active champion versus without one? What's the close-won rate for opportunities that included a reference versus those that didn't? These "with and without" numbers are where a metric starts to carry real weight, because they isolate what your program is actually contributing rather than just what it produced.
The third stage is where the leverage really shows up: partnering with teams like RevOps, sales, and CS so you have both the data and a shared stake in the outcome. Brian framed this as more than a reporting exercise. In a climate where teams are asked to do more with less, being the person who can consistently quantify their own impact is also a way of protecting your career, and it tends to be exactly what gets someone described as "strategic" when promotions come around.
.png)
4. Build the relationships that unlock the data
Stage three is the hardest to reach on your own, since it depends on people outside your team. For Emily, it comes down to mindset more than tactics: treat internal stakeholders the way advocacy teams treat customers. Build trust, understand what they're actually trying to accomplish, and let that relationship do the work of getting you access and buy-in.
RevOps is usually the best place to start, since their job is tied to overall company growth. They already care about win rate on pipeline and whether engagement is driving renewals, and they have both the tooling and the incentive to help you measure it.
Brian added a tactic he genuinely believes in: ask the CFO to lunch. Almost nobody does, and the CFO tends to hold both the data you need and the budget you're eventually trying to justify. Wherever you start, anchor your baselines in your own company's historical data rather than searching for industry averages. It's more relevant to your business, and far easier to get your hands on.
5. What to actually measure
.png)
Zoom out far enough and leadership is really only watching a handful of headline numbers: ARR, NRR, GRR, and similar shorthand for how much revenue is coming in and where. Everything from the sections above rolls up into a few categories that speak that language directly: revenue influenced, revenue created, retention lift, win rate lift, and referenceable accounts.
Referenceable accounts deserves its own callout. Emily has had this one requested directly for board slides: what percentage of your top 20 strategic accounts would actually take a reference call. It doesn't require heavy calculation, but it's one of the clearest signals available for how loyal your most important logos really are.
.png)
Thank you
Thanks again to Gianna, Emily, and Brian for bringing the frameworks and the real-world detail, and to Mary Green and the CMA Weekly community for the questions and energy throughout. Sessions like this one are exactly why we keep showing up in that room.
Champion will be running workshops on building this narrative and presenting your impact on tour this fall. Keep an eye out for details, and if you want help putting any of this into practice sooner, please reach out.